Event Classifier
Presentation for the Institute of Neurology, UCL
06-OCT-11 (Modified 08-JUL-25)

Kevan Hashemi
Open Source Instruments Inc.
www.opensourceinstruments.com

Objective: find patterns in EEG recordings.
Principle: classify patterns by similarity to examples.
Choose interval length suit the patterns we wish to find.
Long enough for the pattern to distinguish itself from other patterns.
Short enough to contain only one type of pattern.
Here is short seizure with 4 s and 1 s interval.
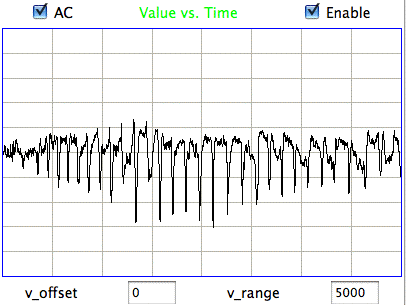
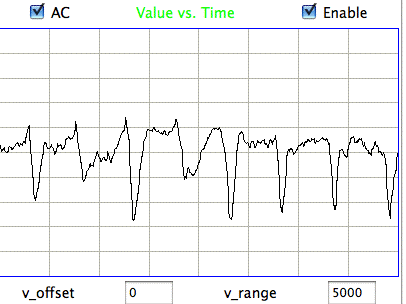
In this example, 1-s interval is best.
Have been using 1-s intervals for all initial studies.
Electrode sensitivity varies from one implant to the next.
Electrodes sensitivity decreases with time.
Transmitter gain increases at end of life.
Cannot use absolute power measurement to detect events.
In live animals, EEG is always active.
Define baseline power as the minimum power in recent history.
Calculate baseline power with following algorithm.
Measure interval power as a multiple of baseline power,
Arrive at dimensionless power measurement calibrated for each sensor.
We assume that baseline power in event band is a non-event.
Continue by assuming interesting patterns have high power.
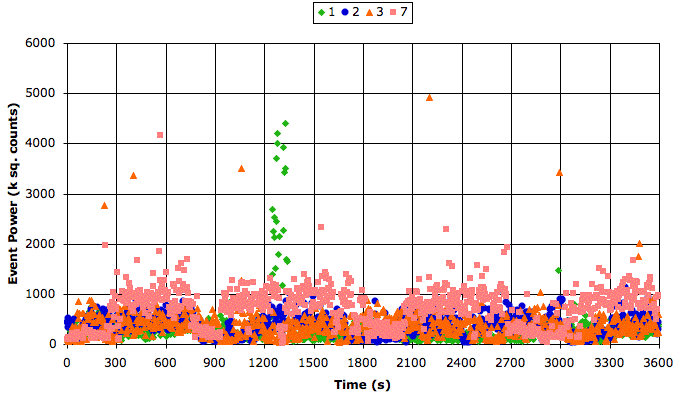
Calculate ratio (event power) / (baseline power)
Events below threshold, say ratio of 5.0, are NORMAL.
Following graph shows a seizure on green channel.
Pattern properties that use power in varieous frequency bands.
As all metrics: must be constrained to values 0.0 to 1.0.
Event Power Metric:
set event_pwr [expr 0.001*[Neuroarchiver_band_power $event_lo $event_hi 0 1]]
set event_m [expr 1.0 / (1.0 + pow(5.0/($event_pwr/$baseline_pwr),1.0))]
Has value 0.5 when event band power is five times the baseline power.
Transient Power Metric:
set transient_pwr [expr 0.001*[Neuroarchiver_band_power 0.1 [expr $lf_lo - 0.1] 0 0]]
set transient_m [expr 1.0 / (1.0 + pow(5.0/($transient_pwr/$baseline_pwr),0.75))]
High Frequency Power Metric:
set hf_pwr [expr 0.001*[Neuroarchiver_band_power $hf_lo $hf_hi 0 1]]
set hf_m [expr 1.0 / (1.0 + pow(0.1/($hf_pwr/$event_pwr),1.0))]
Event Classifier shows map of library events for any two metrics.
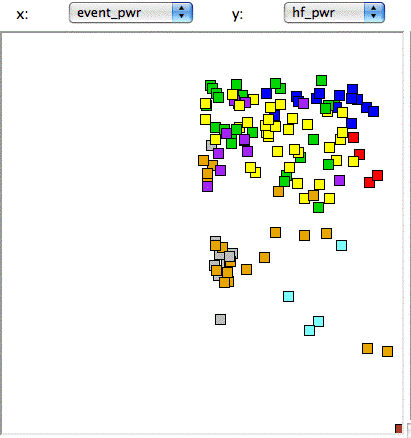
Measure of how high-frequency power varies during interval.
Most computationally intensive metric.
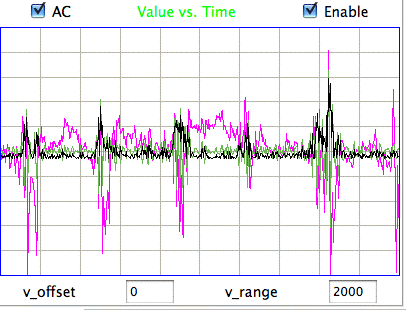
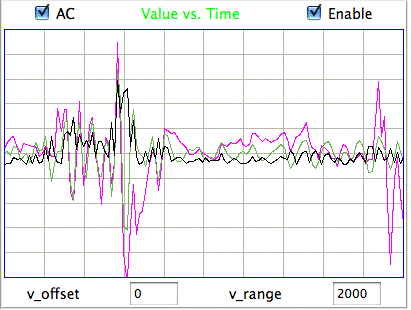
Filter signal to high-frequency band, say 60-160 Hz.
Rectify signal, so negative values become positive.
Take spectrum of rectified signal, limit to 4-60 Hz, measure power.
Divide by event power, put through sigmoidal function to limit value 0.0 to 1.0.
Two metrics that consider how the signal varies with respect to its average value.
Asymmetry:
set count 0
set upcount 0
set downcount 0
foreach v $info(values) {
  if {($v - $ave) >= 2.0*$stdev} {incr upcount}
  if {($ave - $v) >= 2.0*$stdev} {incr downcount}
  if {abs($v - $ave) >= $stdev} {incr count}
}
if {$upcount > $downcount} {
  set asymmetry [expr 0.5+1.0*abs($upcount-$downcount)/$count]
} {
  set asymmetry [expr 0.5-1.0*abs($upcount-$downcount)/$count]
}
Spikiness:
scan [lwdaq ave_stdev $info(values)] %f%f%f%f ave stdev max min
if {$stdev > 0} {
  set spikiness [expr ($max-$min)/($stdev)]
} {
  set spikiness 1.0
}
Shows map of library events, and list of library events.
The "match" is distance from a new event to nearest neighbor.
The "limit" is the maximum distance for valid match.
Beyond limit, classify event as "Unknown".

Choose interval length.
Prepare classification processor: choose metrics.
Apply processor to a few hours of data, produce characteristics files.
Go back to start of the recording.
Use Event Classifier to find a few events and classify them.
Apply Batch Classification to characteristics files with "match limit" to 0.2.
Go through list of unknown events and classify these by eye.
Proceed again with batch calssification until satisfied with library.
Apply library to characteristics files of entire recording.
Produce lists of events for each channel, or all events for all channels.